We stock the boards, sensors and modules this project needs. A full parts list is coming soon — for now, browse our DIY Kits & components or search for AI / ML parts.
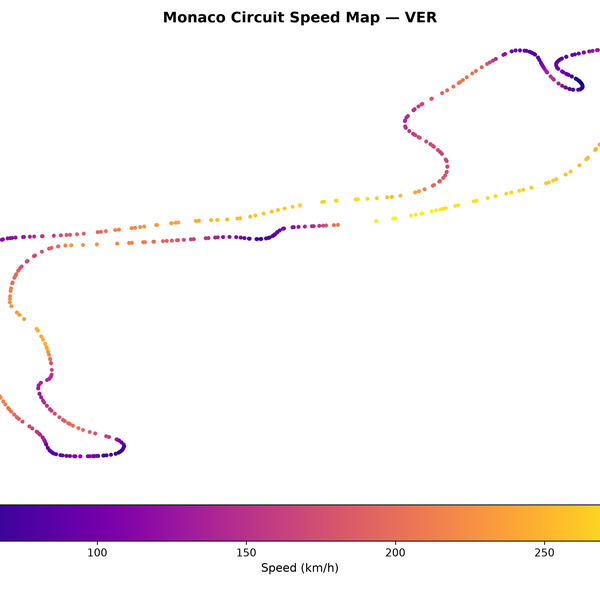
The F1 Telemetry & Speed Profile Plotter operates as a software-based IoT and data pipeline system running on a local computer. Instead of utilizing traditional hardware microcontrollers, the system leverages the Python programming environment to interface with external web-based endpoints via the FastF1 API. When executed, the script requests official session data, lap timings, and high-frequency car telemetry—such as speed, throttle, brake, gear, and spatial coordinates—from Formula 1 databases. Once retrieved, the raw data is ingested into Pandas DataFrames and processed using NumPy arrays to clean, synchronize, and perform mathematical transformations on the telemetry streams. For instance, spatial coordinates and instantaneous speed values are mapped together to evaluate vehicle performance across specific track sectors. Finally, Matplotlib renders these computations into comprehensive 2D spatial track heatmaps and speed profile plots, allowing an engineer to visually inspect where a driver gains or loses time on a circuit.
Why Build This
Bridge the gap between theoretical data structures and real-world engineering analytics by processing large multi-variable datasets from professional motorsport.
Develop practical proficiency in programmatic API data ingestion, data frame manipulation, and numerical computing pipelines.
Gain domain-specific expertise in motorsport telemetry visualization, race strategy evaluation, and performance optimization techniques relevant to undergraduate automotive or data science curricula.
Real-World Application
Motorsport data analysis, race strategy optimization, and telemetry visualization for professional or amateur racing teams.
Skills You'll Learn
API data ingestion
programmatic data wrangling
time-series data alignment
vectorised numerical computation
2D scientific data visualization
Safety Precautions
No specific precautions noted for this build — always follow general electronics safety practices.
Technology Tags
PYTHON
FASTF1 API
PANDAS
NUMPY
MATPLOTLIB
DATA VISUALIZATION
TELEMETRY
Frequently Asked Questions
No. This is a pure software and data analysis project that runs entirely on a computer using Python and pre-recorded telemetry data from the FastF1 API.
A foundational understanding of Python syntax is expected, specifically familiarity with importing external libraries, working with tabular data structures like DataFrames, and writing basic functions.
The FastF1 API provides access to historical session data and telemetry from past Grand Prix weekends, meaning you can analyze archived races, qualifying sessions, and practice runs at any time.
Gallery
This page is part of Kitkraft's Project Hub — a curated collection of electronics & robotics projects gathered from the maker community to help students and hobbyists discover and learn to build. Kitkraft does not claim authorship of the original project, and makes no representation as to the accuracy, completeness or safety of third-party source material. The summary and "How It Works" explanation above are AI-generated, rewritten with reference to the original tutorial — not a reproduction of it. Full credit and a direct link to the original source are provided above. If you're the original creator and have a concern about how your work is represented here, please contact us and we'll address it promptly.
Kitkraft Project Hub — curated from the maker community, credited at the source.