This project is sourced from another site, not written by us — this list is our best match of their components against what we stock, not a verified bill of materials. Always check the original blog (linked above) for the actual parts list before buying.
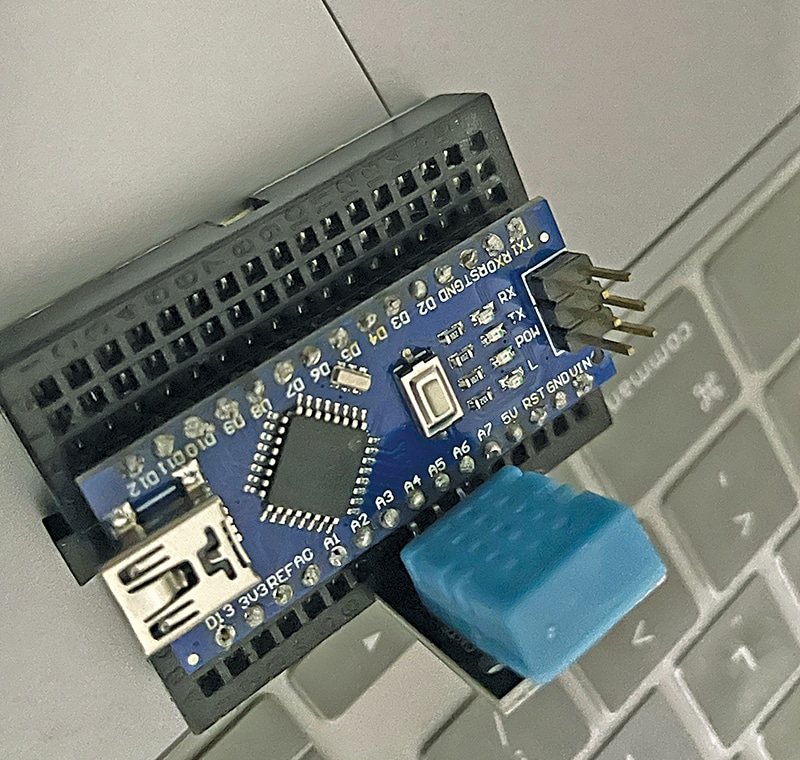
The Real-Time Environmental Data Logger and Plotter functions by combining hardware-based environmental sensing with software-based data visualization. At the heart of the hardware circuit is the Arduino Nano, which acts as the central processing unit. Connected to the Arduino Nano is a DHT sensor, responsible for physically measuring the surrounding temperature and relative humidity levels in real-time. The Arduino Nano reads these raw sensor signals through its input pins and processes the data. To bridge the hardware with a computer, a USB C adaptor is used to establish a reliable physical link between the microcontroller and a workstation running Python. Through this serial connection, the Arduino continuously streams the gathered temperature and humidity metrics. On the software side, the Arduino IDE is first used to program the microcontroller to handle sensor polling and serial communication. Once running, a Python script on the computer reads the incoming data stream over the USB port. Python's plotting and data-handling libraries then take these incoming numbers and instantly render them into live, dynamic visual charts. This creates a closed-loop system where physical environmental changes are captured by the DHT sensor, digitized by the Arduino Nano, transmitted via the USB C adaptor, and finally displayed graphically on a computer screen for analysis.
Why Build This
Gain hands-on experience bridging physical microcontroller hardware with software visualization tools like Python.
Build a practical monitoring system useful for tracking classroom or home environmental metrics for science projects.
Understand how environmental sensors communicate raw data over serial interfaces to external applications.
Real-World Application
Monitoring living conditions in homes and workplaces, as well as tracking climate changes and environmental metrics.
Skills You'll Learn
Microcontroller programming
Serial communication
Sensor data acquisition
Data visualization with Python
Hardware-software integration
Safety Precautions
No specific precautions noted for this build — always follow general electronics safety practices.
Technology Tags
ARDUINO
PYTHON
ENVIRONMENTAL MONITORING
DATA LOGGING
DHT SENSOR
SENSORS
Frequently Asked Questions
Yes, other boards like the Arduino Uno can work similarly, but the code and pin connections may need adjustment to match the specific form factor of your chosen board.
You typically need libraries capable of handling serial communication (like PySerial) and data plotting (like Matplotlib) to receive and visualize the data stream.
The computer receives data via a USB connection through the USB C adaptor, which establishes a virtual serial port over which the Arduino transmits sensor readings as text.
Gallery
This page is part of Kitkraft's Project Hub — a curated collection of electronics & robotics projects gathered from the maker community to help students and hobbyists discover and learn to build. Kitkraft does not claim authorship of the original project, and makes no representation as to the accuracy, completeness or safety of third-party source material. The summary and "How It Works" explanation above are AI-generated, rewritten with reference to the original tutorial — not a reproduction of it. Full credit and a direct link to the original source are provided above. If you're the original creator and have a concern about how your work is represented here, please contact us and we'll address it promptly.
 Arduino Nano C Type V3 ATMEGA328 with Soldered Headers
Rs. 608.00
 MB102 Adjustable Breadboard Power Supply Module (3.3V & 5V) for Arduino & Raspberry Pi
Rs. 139.00
 400 Points Mini Solderless Prototype PCB Breadboard High Quality
Rs. 89.00
 Jumper Wire 10 Pin Male To Male 20cm
Rs. 45.00
 Jumper Wire 10 Pin Male To Female 20cm
Rs. 45.00


