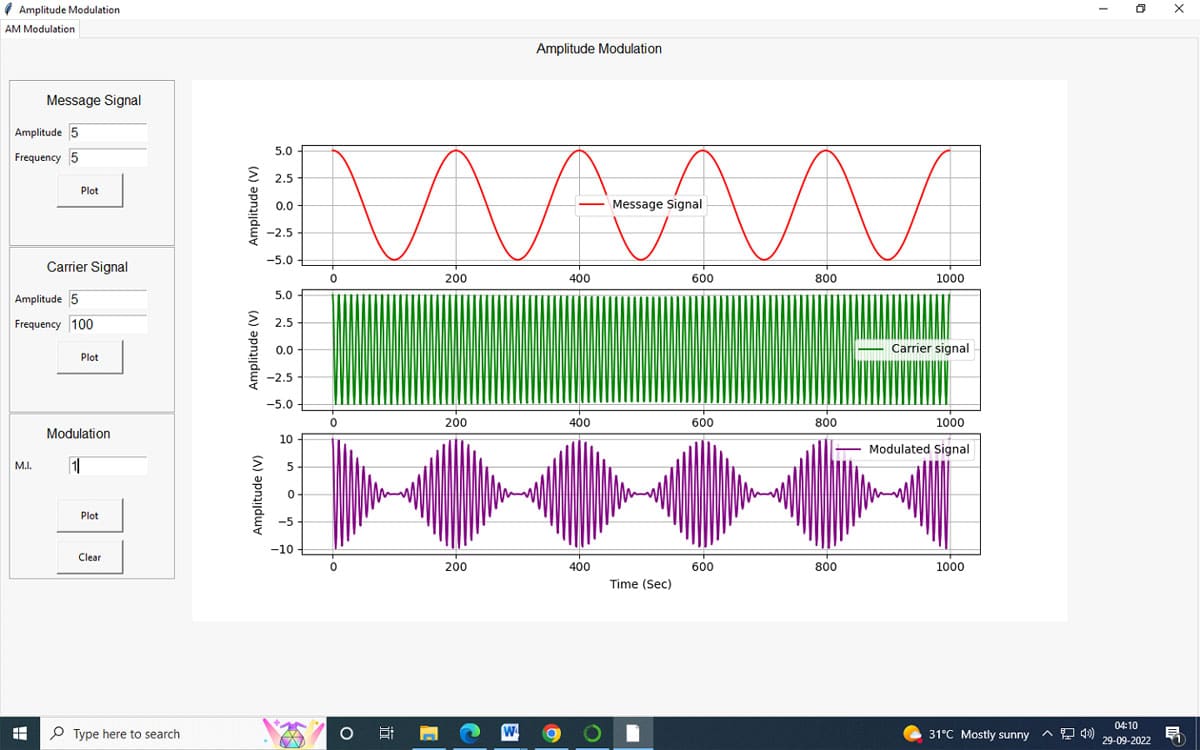
Amplitude Modulation Simulator with Python GUI and Raspberry Pi
A Python GUI-based amplitude modulation simulator built on Raspberry Pi using Jupyter Notebook, Tkinter, and Matplotlib to study and test AM signals.
Parts You'll Need
This project is sourced from another site, not written by us — this list is our best match of their components against what we stock, not a verified bill of materials. Always check the original blog (linked above) for the actual parts list before buying.
-
 Raspberry Pi 3 - Model B+ 1.4Ghz 64-bit quad-core Processor with 1 GB Ram (Original)
Rs. 5,400.00
-
 MB102 Adjustable Breadboard Power Supply Module (3.3V & 5V) for Arduino & Raspberry Pi
Rs. 139.00
-
 Jumper Wire 10 Pin Male To Male 20cm
Rs. 45.00
-
 400 Points Mini Solderless Prototype PCB Breadboard High Quality
Rs. 89.00
-
 Jumper Wire 10 Pin Male To Female 20cm
Rs. 45.00


We don't carry yet: LCD (generic / unspecified)
Browse all componentsHow It Works
Why Build This
Real-World Application
Skills You'll Learn
Safety Precautions
Technology Tags
Frequently Asked Questions
Gallery
This page is part of Kitkraft's Project Hub — a curated collection of electronics & robotics projects gathered from the maker community to help students and hobbyists discover and learn to build. Kitkraft does not claim authorship of the original project, and makes no representation as to the accuracy, completeness or safety of third-party source material. The summary and "How It Works" explanation above are AI-generated, rewritten with reference to the original tutorial — not a reproduction of it. Full credit and a direct link to the original source are provided above. If you're the original creator and have a concern about how your work is represented here, please contact us and we'll address it promptly.