This project is sourced from another site, not written by us — this list is our best match of their components against what we stock, not a verified bill of materials. Always check the original blog (linked above) for the actual parts list before buying.
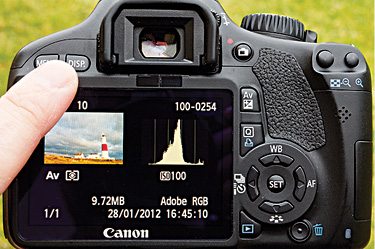
In this project, a digital camera captures an image, which is then transferred to a computer for computational analysis using MATLAB. A digital image is fundamentally represented as a grid of pixels, where each pixel contains numerical values corresponding to color intensities, typically across Red, Green, and Blue (RGB) channels, or converted into grayscale. A histogram acts as a graphical representation of the tonal distribution within this image. The horizontal axis of the histogram represents the range of possible pixel brightness values—usually spanning from 0 (pure black) to 255 (pure white) for 8-bit images—while the vertical axis shows the absolute count or frequency of pixels that possess a specific brightness level. MATLAB reads the image matrix data and processes these intensity values to plot the frequency distribution. By analyzing the shape, spread, and shifts of the histogram curve, engineers and photographers can objectively evaluate exposure characteristics. For instance, a histogram clustered entirely on the left side indicates an underexposed image, whereas a curve pushed entirely to the right indicates overexposure and potential clipping or loss of detail in bright highlights. Through MATLAB scripts, users can manipulate these matrices, extract specific color channels, and automate the quantitative assessment of image quality without relying solely on subjective visual inspection.
Why Build This
Gain practical MATLAB programming experience for processing and analyzing 2D digital image matrices.
Learn quantitative methods for evaluating camera exposure and image quality control in computer vision workflows.
Understand the mathematical foundation of tonal distribution for precision agriculture and remote sensing applications.
Real-World Application
Used in digital photography, professional camera systems, and computer vision applications for exposure analysis and image quality control.
Skills You'll Learn
digital image processing
MATLAB matrix manipulation
histogram analysis
exposure evaluation
data visualization
Safety Precautions
No specific precautions noted for this build — always follow general electronics safety practices.
Technology Tags
MATLAB
IMAGE PROCESSING
DIGITAL CAMERA
HISTOGRAMS
PIXEL INTENSITY
Frequently Asked Questions
Any digital camera that allows you to transfer image files to a computer can be used, as the actual processing and histogram generation take place entirely within MATLAB.
Basic matrix operations and built-in plotting functions in standard MATLAB are typically sufficient to read image files, extract pixel values, and generate histograms.
An overexposed image will show pixel data heavily crowded on the far right side of the histogram axis, indicating that a large number of pixels have reached maximum brightness and lost textural detail.
Gallery
This page is part of Kitkraft's Project Hub — a curated collection of electronics & robotics projects gathered from the maker community to help students and hobbyists discover and learn to build. Kitkraft does not claim authorship of the original project, and makes no representation as to the accuracy, completeness or safety of third-party source material. The summary and "How It Works" explanation above are AI-generated, rewritten with reference to the original tutorial — not a reproduction of it. Full credit and a direct link to the original source are provided above. If you're the original creator and have a concern about how your work is represented here, please contact us and we'll address it promptly.
 ESP32 CAM WiFi Module Bluetooth with OV2640 Camera
Rs. 810.00
 400 Points Mini Solderless Prototype PCB Breadboard High Quality
Rs. 89.00
 MB102 Adjustable Breadboard Power Supply Module (3.3V & 5V) for Arduino & Raspberry Pi
Rs. 139.00
 Jumper Wire 10 Pin Male To Male 20cm
Rs. 45.00
 Jumper Wire 10 Pin Male To Female 20cm
Rs. 45.00


